Today’s post combines the topics of the previous two posts and moves into Power Query to connect to SQL directly instead of connecting to static, exported SmartLists or flat files.
Previous posts in this series:
What this post covers
In this post, I am using the same context of the Payables Transactions type of information I showed in the first post on starting from scratch. I won’t keep repeating Payables as the example forever, but I do want to show how the underlying view is identical to the SmartList. This will continue into the next post but after that, I will move on to other modules!
- Connecting to SQL Server directly in Power Query (I’m using Excel, but the same approach works in Power BI).
- Connecting by selecting objects vs. entering a SQL query.
- Compare using the out-of-the-box views vs. using the tables (pros and cons).
Data Permissions
For the sake of simplicity in demoing, I am granting permissions via out-of-the-box rpt_* roles initially. I do not want to give my “demo user” read-only access to everything in the database for the reasons I mentioned in my Data Access post, but I do not want to turn each of these posts into a SQL permissions discussion either!
For this demo and anything Accounts Payable related, these are the permissions that give most of what those users would likely require:
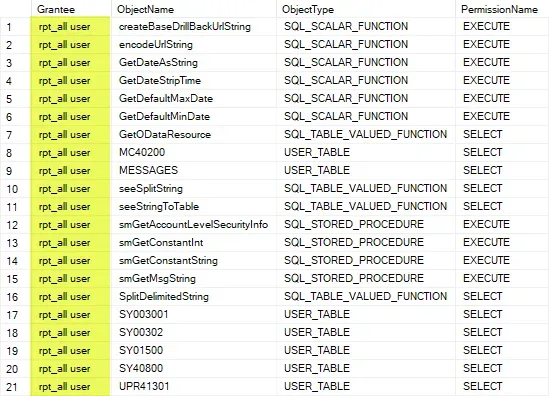
- In the System database (typically DYNAMICS), assign the role “rpt_all user” to the user(s) who need to refresh the data. This assigns some generic items to the users that may be referenced in company-specific views.
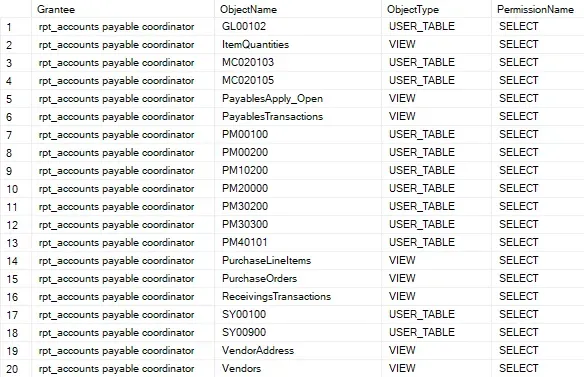
- In the COMPANY database(s), give the user or group the role “rpt_accounts payable coordinator”. In the screenshot, some objects are not shown, there are more things this role has access to than what is pictured below.
💡 Reminder: the rpt roles are there primarily for assigning to users who may be running the out of the box SSRS or Excel reports. They contain a variety of items all Accounts Payable related.
In all cases in this post, I am connecting to the Database > SQL server option under New Source. In these examples, I have connected to the dataset previously and have already provided my credentials. If I had not yet connected to this data before, there would be prompts to authenticate to the data source that I will not cover here. Revisit the Data Access post for more details.
New Source (no query option)
In this option, I have entered both a serverinstance name and a database name but did not expand the Advanced options section. Click OK to continue.
In the Navigator window, this visually will display what I have access to in the database and I need to expand the database to see the object names. If I had chosen not to list a database, I would see multiple databases and likewise, could expand them to view the objects to which I have access.
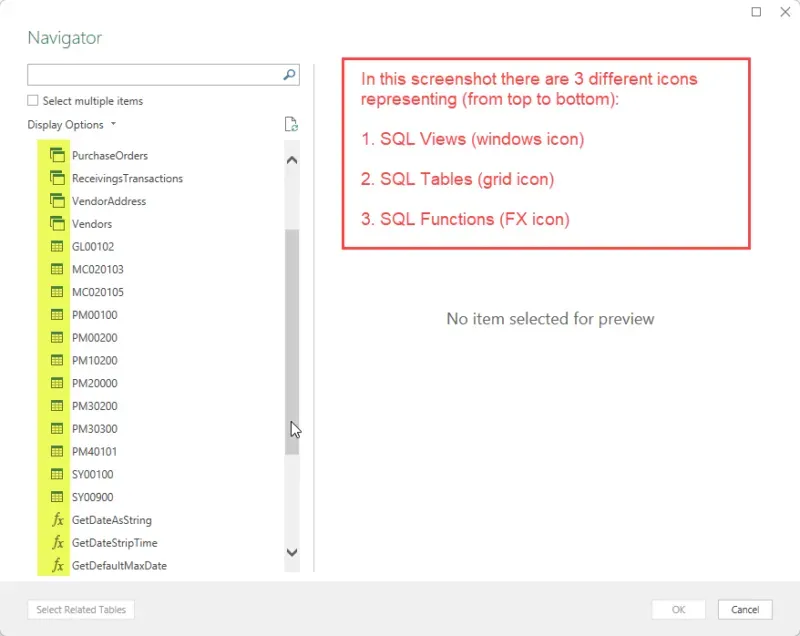
At this point, I can select an object and preview it, OR I can tick the box that says “Select multiple items” to select more than 1 object. The preview is helpful if I am not sure about what type of data the object contains. In some cases, the previews may only show 1 row of data; what is shown depends on the amount of data in that object (number of columns etc.). If I want to use tables and am not familiar with the table naming conventions, I definitely would find the preview helpful to at least see column names and a few rows of data.
This approach allows me to see what I have access to and to figure out the names of the objects. For a user first starting with this, unfamiliar with the tables and content, this would be a good way to get familiar with things.
For every object I select, clicking OK at this point will create 1 query per object. For those following along, go ahead and select one or more tables or views and see what is returned. It’s easy enough to delete a query if it is just for testing what happens as the steps can be repeated to do it a different way. What I chose here was 1 object: the PayablesTransactions view.
New Source (entering a query option)
I’m adding another query now, one that ultimately will contain similar data, but I’m using a query and pulling from the tables directly, not the view. In general, I prefer to type in a query because often I want to select multiple tables, that typically would be related and I don’t want separate queries, I want to join them; however, by entering a specific query, I may be breaking the Query Folding that Power Query would be doing. I will be covering more about this in a future post.
This post is not intended to cover types of joins and other concepts around that, so excuse the brevity of my explanations below. In the case of the PayablesTransactions view, it already contains most of the vendor information, but in the case of using the tables, those don’t contain all the data one would typically require for a report, so a join is necessary.
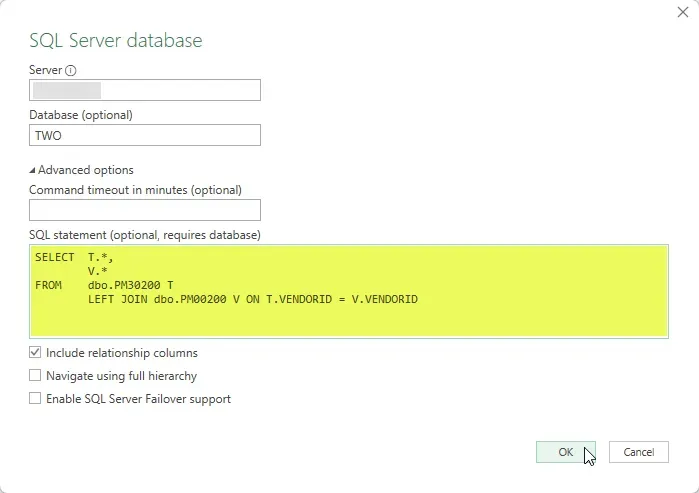
Here again, is my connection where I put the query in. The only difference between the previous source and this is the query highlighted in yellow.
Here is a very simplistic explanation of the query, for those unfamiliar with SQL syntax:
- The general format of a query for this type of purpose is “SELECT
FROM WHERE “. - “SELECT” means get or read the data. My T.* means “get all columns from the object with alias “T”, and the same for “V.*”.
- “FROM” is what objects to pull from (views, tables etc.).
- I have not filtered the data with a WHERE clause, but could have pre-filtered to say, invoices only (“where doctype = 1”) or a date restriction for example.
- One general comment: where possible, always perform these transformations (filtering) in SQL vs. pulling all the data and filtering in Excel or Power BI.
- Tables:
- PM30200 is Payables Transaction History (i.e., fully paid or applied transactions).
- PM00200 is Vendor Master.
- The join is necessary to identify how they are related to each other.
- In this case, the Vendor table is related to the transaction on the VendorID field, but it is possible in other scenarios with other tables to specify more than one join field.
- “LEFT” join means I will get all of the records in the PM30200 table even if the vendor does not exist in PM00200 anymore because it is the “left” side of the “left” join.
- For example, if a temporary vendor was deleted from the Vendor Master, which is allowed, the transaction will still appear in the data and there will be “null” values in the fields from the PM00200 table because the vendor is not there.
- There are different ways to reference a table or view. The “dbo.” part is optional, this is the schema name, I could have just listed the tables without the dbo reference. I could also have chosen to fully qualify the name by specifying the database which would look like this: TWO.dbo.PM30200.
- I have used aliases “T” for transactions and “V” for vendors.
- ANY alias is fine, some people will use A, B, C etc., and some will specify the table name each time (i.e., no alias).
- I usually try to make it meaningful like I did here with a letter or two that reminds me which table is which when building out my query.
- The alias is referenced after the table or view name and then every column in the table can be referenced with the alias in front like it is on the “join”.
- I’m doing something that is considered bad practice here: I am using the * to “select all fields from that table”. The best practice is to select the fields by specifying the column names that are needed in the query.
- The short version of why is if the underlying table structure were to change in an upgrade and a new column was created, this could break the report the next time the data is refreshed.
- The second reason for selecting only what is needed is simply to reduce the query size and/or the size of the data model. It wastes the first step in Power Query I typically do which is remove the columns I no longer want or need, when I could have specified what I wanted in the query up front.
- FOR THIS POST, know that I am ignoring best practices!
Now when I click OK, I do not see the “Navigator”, Power Query simply creates the query for me, called Query1 (for now).
Tables vs. out-of-the-box Views
In general, there is little difference between utilizing either tables or views in Excel or Power BI. I tend to use views a lot, but I also tend to write my own and don’t use a lot of the out-of-the-box views.
Pros for using the views
In the context of Dynamics GP, the “out of the box” views have been created to simplify the data structure and, in many cases, join data, including joining multiple tables where there are transactions in tables based on their status. Work, Open and History are common terms to understand with Dynamics GP. In many modules, certainly the core modules, transactions move from one set of tables to another based on whether they are posted or not (and other criteria). In some ISV products, like Key2Act Job Cost, for example, objects like Jobs also move from Open to History/Closed tables when the job is closed. For reporting on things that “move” between tables through their lifecycle, often the user needs to pull from data in any state and out-of-the-box views are convenient for that.
One of the other significant pros is the views always (or mostly?) trim the string fields, so one doesn’t end up with extra data in the form of empty spaces in all the text fields. GP databases use “char” datatypes for strings/text. Take a Vendor Name for example, which is 30 characters long. No matter how long vendor names are, the column contains 30 characters every time with spaces padding the data on the right-hand side. That drives me nuts, and when I create my own views, I always trim the data.
Cons for using the views
From my perspective, the biggest con of using out-of-the-box views is they tend to contain everything AND the kitchen sink. Most times I do not need that much data and as I noted above, I tend to create my own views with exactly what I need now and believe I may need in the future, and that’s it. (Of course, I’m being inconsistent in my statement here by using SELECT * from the tables which also returns every column!!)
The other con, which again is a pet peeve for me, is the views use friendly names for the columns (which is a good thing) but those names have spaces in them which makes writing out queries painful. I’m all for friendly field names, but I detest spaces in column names or view column names!
Summary
I am wrapping this post up here, as the next step is getting into the actual data modelling in Power Query which in itself is a huge topic! Next time, I will continue with this example (and yes, that means more Accounts Payable for now!).