A client asked me where they could find out some metric-type information from the last couple of years’ processing in Dynamics GP, such as the number of A/P invoices processed, number of cheques processed etc.; and the same for A/R if possible.
Simple question, not so simple answer. I admit it never occurred to me, that this information isn’t particularly easy to get to in GP in aggregate form, or I’m drawing a complete blank on where to get it. There are many inquiry windows but most with this type of thing are at a customer level, not a company level.
So, I wrote a couple of quick SmartLists – one for A/P, one for A/R, and I thought I’d write it out as this client likely isn’t the first one to ask this question! I’ll call it a poor man’s dashboard… it’s simple, and for those who haven’t delved into dashboards yet or graphs or KPIs, this may suffice for some simple information about what users are processing in Dynamics GP.
Overview
First, I’ll be describing the A/P Metrics SmartList but the same concept will apply for A/R or other modules. I also chose to exclude voided documents altogether using a restriction, but I could have easily handled that within the calculated fields or had a column on its own if # of voids was important. And, lastly, I ignored WORK tables and focused only on OPEN and HIST tables to get posted transaction counts.
I chose to use SmartList Builder from eOne to build these using their Summary smartlist feature, as it didn’t require a SQL view or anything special to get it done. I don’t have any active clients who use SmartList Designer, so I can’t tell if this exact approach can be done via that out-of-the-box tool or not.
The specific approach was to pull data from the transaction tables themselves, and summarize by year and by type or grouped by type of documents. The result would be one record (row) of data per year, with columns for the count of invoices, credit notes, payments etc. This can easily be customized further, to the limit of one’s imagination, as long as one can build a calculated field for what to capture.
There are some summary views already in the database but they aren’t summarized in the same way my client requested, so I didn’t use those.
I’m not walking through the literal how-to-create-a-smartlist steps, but hitting the high-level key points on this one.
Tables to use
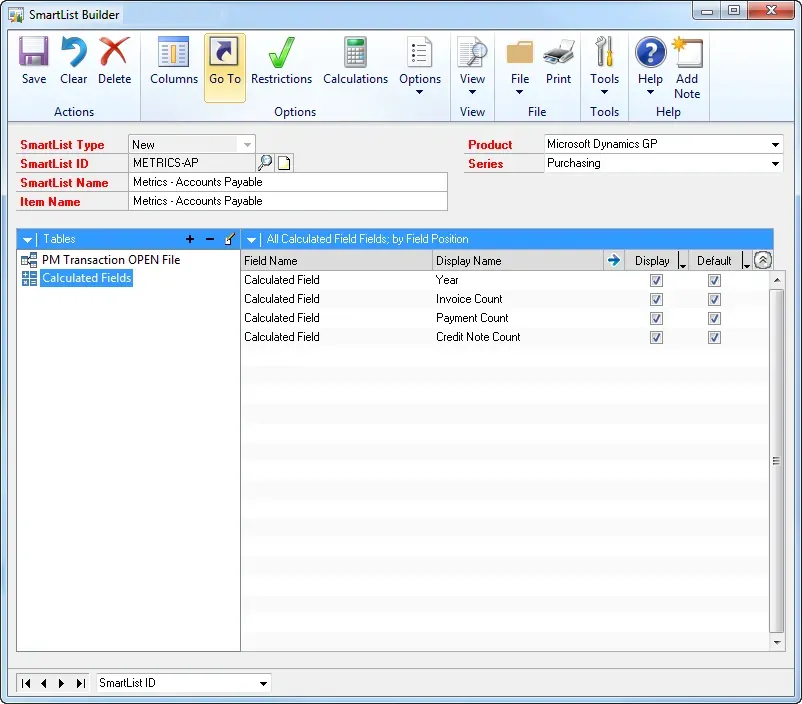
I started with the PM Transaction OPEN File table first. After selecting that table, go back into “edit” the table to select the Matched Tables feature. Smartlist Builder’s (SLB) matched tables feature allows builders to effectively combine related tables like work-open-history versions of transaction tables, without having to create multiple smartlists or create SQL views just to combine the data.
In this case, I wanted the PM Paid Transaction History File, to pull in all paid/historical A/P documents. I named it “PM Trx History” and click Save.
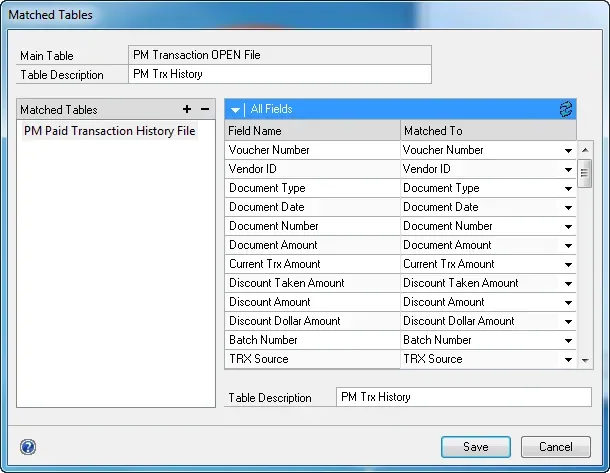
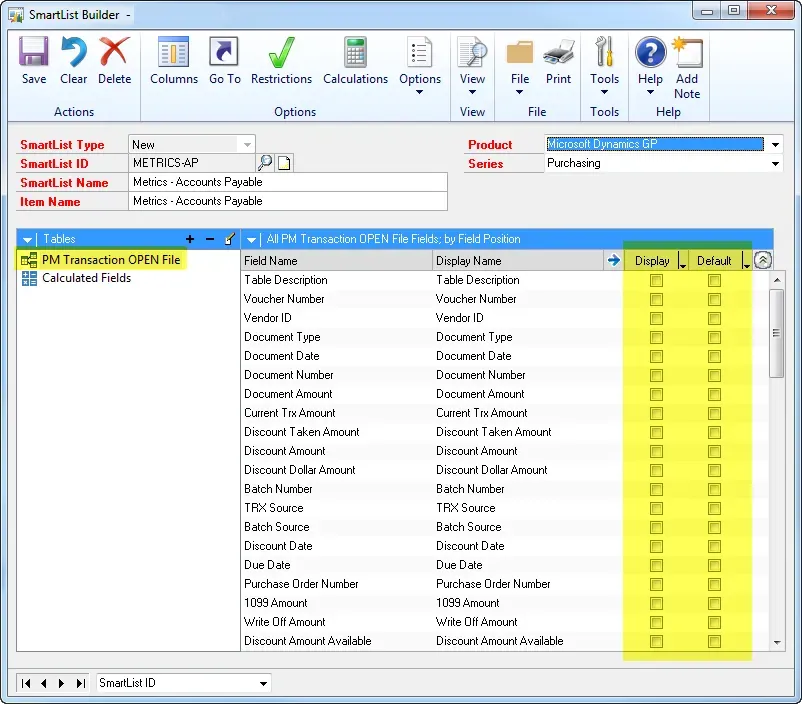
Notice that on that table, I deselected every field that was set to Display. By default, for every table added, SLB assumes every field should be displayed but not defaulted on the “*” SmartList default favourite. In this case, I’m using the data to summarize by calculated fields I’m going to create next, so I don’t want to display *any* fields from the transaction tables.
Calculated Fields
I created 4 calculated fields in my case, the number of fields depends on how granular to break out the counted data or group the data. In my screenshot above, you see the “Calculated Fields” like it’s a table. That appears as soon as you have one or more calculated fields. I took the screenshots after the smartlist was built, hence some screenshots appear out of order in how I am describing this!
Grouping field for Year
In my case, the client simply wanted metrics by calendar (same as their fiscal) year. I wanted to create a field to group by year, specifically the Year of the GL Posting Date. In the A/P transaction tables, this field is called Posting Date. In the A/R transaction table, it’s more clearly labelled GL Posting Date. I created a “String” field for this value.
While I’m on the subject of dates, a brief tangent. For those confused by the various date fields in Dynamics GP, take a look at Steve Endow’s post from last month, referencing a post on Victoria Yudin’s site on what dates mean what. Be aware: “posted date” and “posting date” are not the same thing and can’t be used interchangeably!
I’m using a simple CASE statement – fancy for “if this, then that”. The basic format is:
CASE
   WHEN ___ THEN
   WHEN ___ THEN
   (keep repeating WHEN > THEN as often as needed)
   ELSE ___
END
In my case, this is a highly simplified version of a CASE statement. I can have many “when” statements and I am not limited to “equals”. It uses the SQL syntax so google it and you will see what your options are to see how fancy you can get!
Here is my formula:
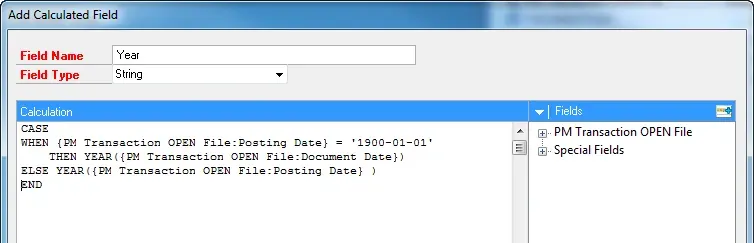
Now, in my screenshot, there is an odd piece in my formula to catch scenarios where the “Posting Date” field in my client’s data happened to be “1900-01-01” for some transactions when they first converted to GP. I didn’t know the history of why and didn’t want to figure it out right at that moment, so I trapped that particular situation in my formula. You may find you don’t need that! In a perfect world, I could simply just make this formula “YEAR({PM Transaction OPEN File: Posting Date})” and that would do the trick, without a CASE statement.
My formula says “If the Year of the Posting Date is empty (GP empty dates = 1/1/1900), then pull the Year from the Document Date; otherwise, use the Year from the Posting Date”. For the handful of outliers in the client data, using the year from the Document Date was fine.
Count fields – Invoices, Credit Notes, and Payments
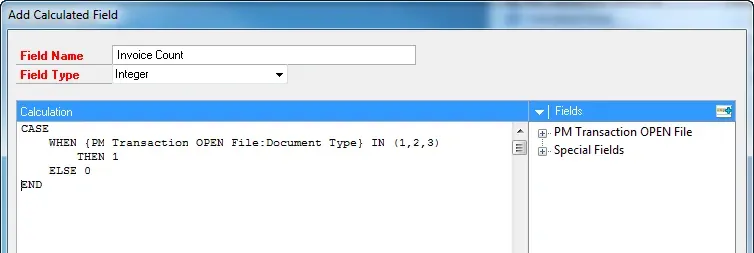
This is the Invoice formula, one of 3 different calculated fields. I’m using it as an example where I don’t have to have a CASE statement be limited to something equal to one thing. For the count of invoices processed, I made the following formula based on the Document Type.
My formula says “If the Document Type is in the following list (“invoice”, “finance charge”, “miscellaneous charge”), then count it (1); otherwise don’t count it (0)”. The “in” is an alternative option to equals, where I specify a list. Since these three document types happen to be sequential numbers, I could also have used < 4 or something like that.
My client didn’t want columns for every one of these things, I’m counting any “positive” charge on the vendor as an invoice. This will count all 3 document types as an invoice.
My Credit Notes field is Document Type “in (5,6)” to capture both returns and credit notes. My Payments formula is Document Type = 6. That covers the 6 A/P document types.
Fields to Display & Default
Once the calculated fields are all created, I want to mark them all to be Displayed and Default.
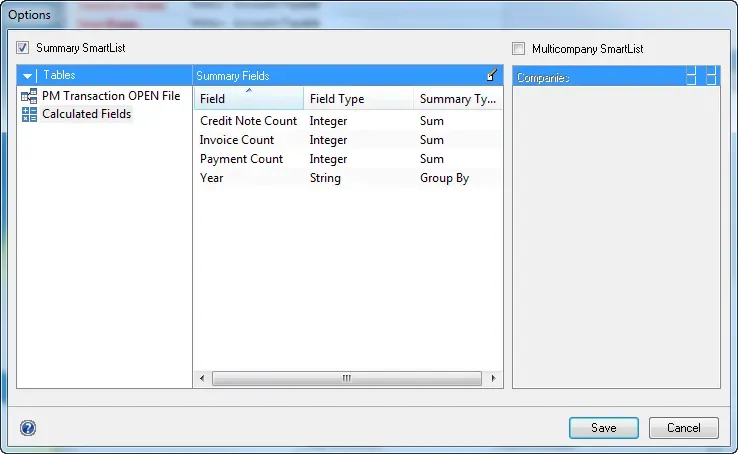
Create the Summary
On the Options menu, click on Summary to create a summary SmartList. Tick the box “Summary Smartlist”, then click on the Calculated Fields and change the Summary Type using my screenshot as an example.
I want to “group by” Year, which means show one row/record per year. I want to “sum” each of the other fields, as I used 1’s and 0’s to easily “count”. I could also use count but I tend to prefer sum.
At this point, if I wanted to group by other fields, such as Vendor Class or something, I would need to make that field set to Display and Default, and then change its Summary Type to Group By as well.
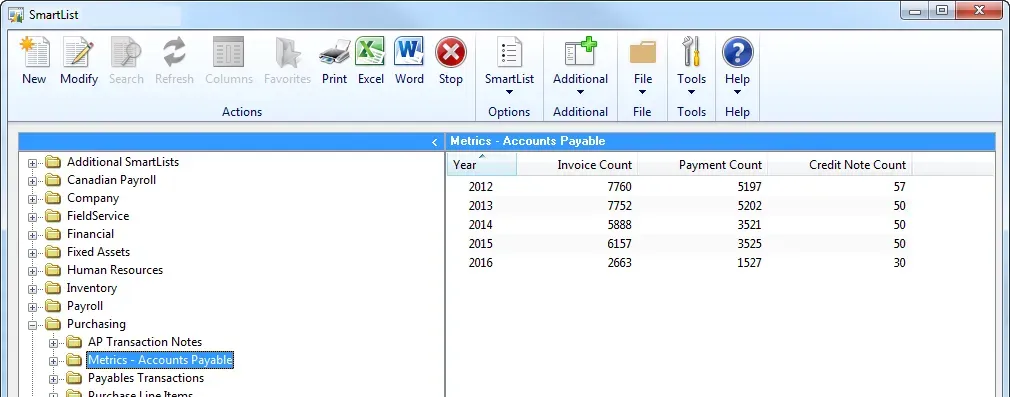
Final Result
Here’s an example of what the final SmartList should look like if all goes well.
I don’t have a screenshot but I did add a Restriction to only count non-voided transactions.
To validate the data, before I made this available to the client, I put a temporary restriction to only summarize a specific vendor that has lots of transactions over several years. I used the Vendor Yearly inquiry window to cross-check some of the totals to make sure the data was making sense, then removed that restriction so it pulled all vendors again. It seamlessly combined open and historical transactions using the matched tables feature which made it quick and simple to produce this!
Hope this helps someone!