Here, at long last, is my next-to-last blog post in the Report Writer series. It’s not that I’ve covered everything to possibly know about Report Writer, not by a long shot, but what I’ve found is some of the basic information I’ve shared thus far wasn’t as easy to find as the more advanced stuff was. What’s next? Using VBA with Report Writer? Editing package files? Adding Extender fields to a Report Writer report? There are many things like these that are already covered by the Dynamics GP community. In my last article, I will summarize my series with links to all of the posts.
Now onto this article… This one is a bit of a hodge-podge of things, there is no particular reason why these are all lumped together in one! The items here probably deserve more in-depth discussion but for this blog, I just wanted to highlight a few key things about them rather than dig deep into their usefulness.
Keys
All tables have keys which are fields in which the data is primarily linked by, sorted by, filtered by etc. The key fields are usually obvious – Customer Number in a customer table, Voucher or Transaction Number in a transaction table etc. In Report Writer there are a lot of different key combinations other than what users might expect if they were merely determining the primary keys on which to link a table. For example, I’ll use the PA Project Master table, from my earlier Custom Reports blog article. Key 1 happens to simply be Project Number. That’s great for several reports, but what if I wanted to create a report or customize an existing report to add a new section? Here is the sections window for my custom report I wrote last week, where I kept Key 1 as my Key:
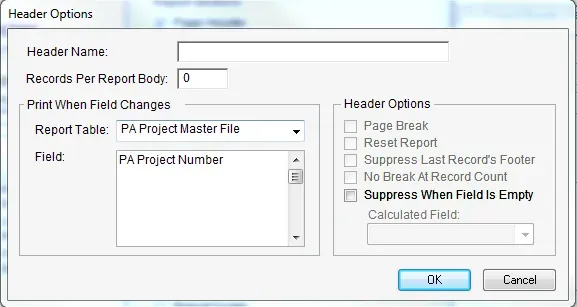
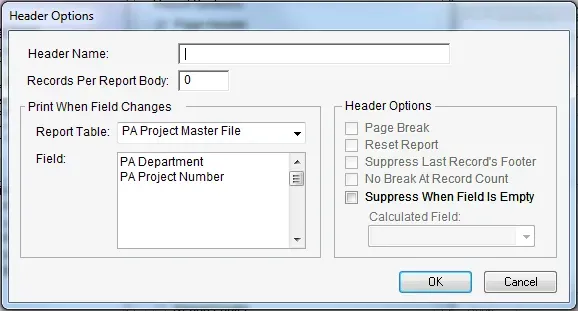
Notice that the PA Project Master File only gives me one option for creating a section on my report: Project Number. What if I want to create a report for each department, listing their projects and statuses? Looking at the different keys available for this table, Key 8 is Project Number and Department. If I select that key on my Report Definition, this is what I see for section options:
Where do I find key information? Look under Tables, find the table name, and browse through the keys to see what fields are combined.
Sorting Options
First, a word of warning. Be very careful changing Sort options on existing reports. It can REALLY mess up the output of a report if one is not aware of the implications of the change. Here is how I look at it when deciding if I can modify the sort options:
- Is the report generated through a window where the user has a choice of sorting the information? Example: Trial Balance reports, all have sorting options within the user interface. If a sort option is “hard-coded”, that completely blows away the intent of the user being able to select a sort option themselves. I avoid changing the sort in this scenario.
- Does the report have multiple sections? If so, make sure to sort all the sections appropriately so the users don’t end up with mismatched data. Here I’m careful but if I know how the report sorts now, I will do it.
My example for sorting deals with a commonly requested modification and the problem of having multiple sections in a report: “Can I sort my A/P Cheque remittance stub by date instead of document number?”. I’ve seen a few people try this and fail only because there are multiple sections and the sorting needs to occur in the right order. So, using the “Check with Stub on Top and Bottom – Graphical” as my example, here is how one could change the sort so it sorts by Date on the remittance stub instead of by Document Number.
First, look at the sections on the report to see how the report is grouped. In this case, the grouping is by cheque number or Document Number, in the PM Payment Work table. So if I want to change the sort, I still need to make sure my first sort is by Document Number of the PM Payment Work table (sort by cheque number first, then sort by date on the remittance stub). This is the part people often miss. What happens if I just put a sort in by Date? It sorts the cheques by the date of the remittance on the cheque stub so if I have a batch of 3 cheques, each paying various documents, instead of 3 “pages” (one per cheque), I may get as many as 3 times “x” pages (depending on the number and dates of the documents that are paying that would appear on each vendor’s cheque).
Here’s how to do it:
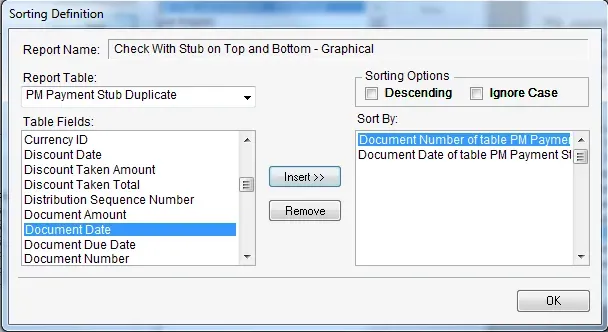
- First, insert the first sort as Document Number from the PM Payment WORK table (Document Number of the payment = Cheque Number).
- Next, click on the Document Number of table PM Payment WORK line in the Sort By column so it’s highlighted. This tells Report Writer that the next sort option I want to insert is to go AFTER this not before.
- Then, insert (for instance) the Document Date from the PM Payment Stub Duplicate table.
Here is what it would look like for this example:
Restrictions
Instead of repeating the same warning from the above Sorting section, I will simply say please be careful with inserting restrictions in a report. For all of the same reasons, restricting data by hard-coding something doesn’t make sense many times as the users are often given the option to insert their own. So, creating one at the report writer level can be dangerous and frustrating to a user who doesn’t know why some data does not appear on their report.
That being said, creating a restriction is a lot like creating a calculated field. Here is a very simplistic example: hiding inactive GL accounts from a report. The key to restrictions is putting a formula in of what should be restricted, not what should be shown.
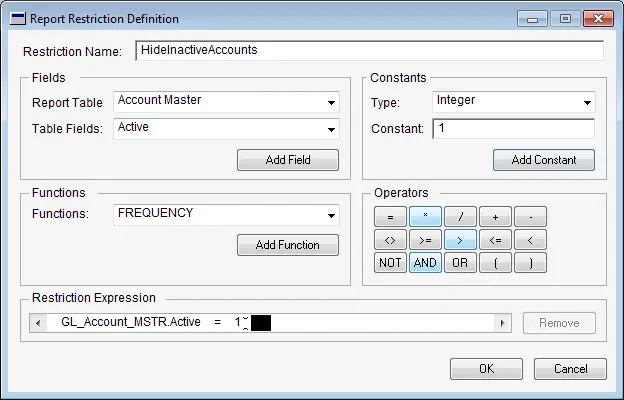
In this example, I’m restricting “Active” = 1 (inactive).
Grid & Align to Grid
This one is simple… under the Layout menu (within the Layout of a report), there are a few options around Grids. First is simply “Grid” meaning: is the grid turned on or off. A grid is a matrix of virtual lines in the background to help keep things lined up on the same “line” so to speak. The grid size is pre-defined, unlike other tools where there are options for how large a space between grid lines is. See the grid by selecting Show Grid.
A checkmark beside the Grid option means it’s turned on. Moving text or fields around, they “snap” to the pre-defined grid pattern. I usually keep the grid on except for very minor section adjustments because it’s easier to keep it on than to constantly use the alignment tools for very simple tasks.
Align to Grid is an interesting one. Say the grid is turned off and just randomly put a bunch of text fields on a report (for headings perhaps), and they are not aligned. Use the Arrange tool in the toolbox to align the fields to the same bottom point. Select them all and then select Align to Grid from the Layout menu, and watch them snap into place to the nearest grid point. What’s the diff? Well, simply put, the most common font sizes on most reports align nicely within the pre-defined grid so sometimes I simply align the fields to the grid so they snap to a gridline, then move them from there.
How to move a field between grid lines? This is called Nudging and using the arrow keys on the keyboard to move up, down, left or right (to nudge the field(s) selected) a little bit at a time. Often nudging is enough to move things just a little bit off the grid or to create a small visual space between items. Often this is easier than turning the grid off since you can manage the number of spaces/nudges that your fields move easier than with a mouse free-hand.
When do I remove the grid? When I want to adjust a section size, if there is text or fields in the way, I cannot move it by an entire grid increment so I will turn the grid off and use my mouse to adjust the size of the section.
Next post I’ll do a wrap-up of what I’ve covered and where to look for additional sources of good information!