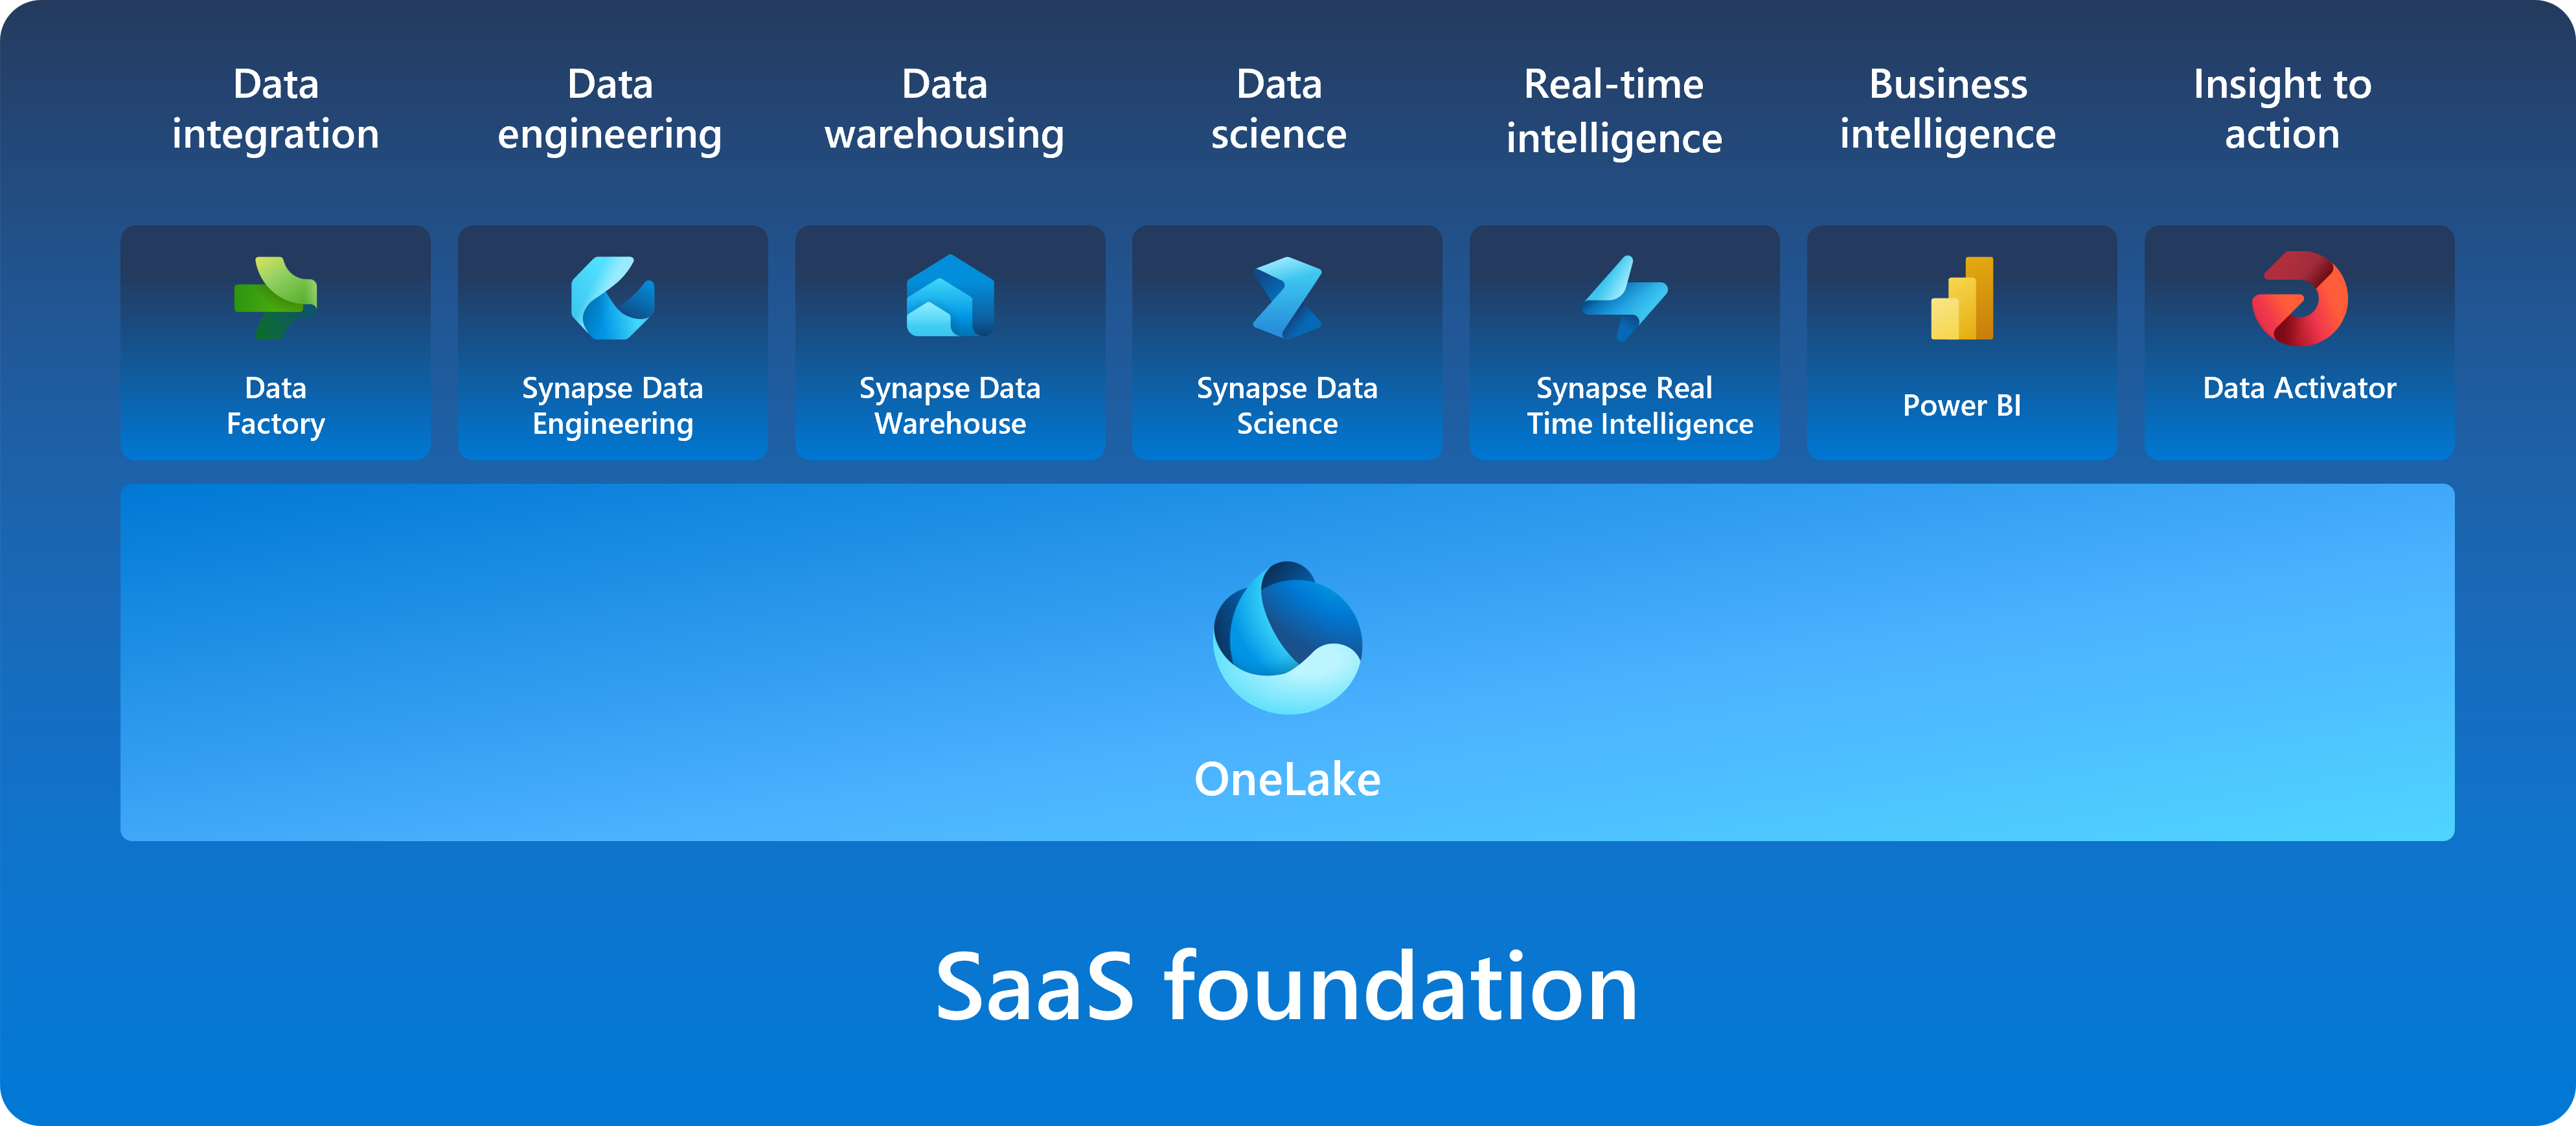
As I wrote in my introductory post a couple of days ago (which can be found here), this is the start of a series following my journey through the Microsoft Learn cloud skills challenge "Fabric Analytics Engineer". I'm coming from a Power BI perspective, so the majority of Microsoft Fabric components I have not been hands-on with before this training.
The first few posts in this series will follow the modules in the order that the Learn Together live training occurred, which is slightly different than the order of the modules as presented in the Microsoft Learn challenge itself. The modules not covered by Learn Together sessions I will cover at the end of this series.
Microsoft Learn Modules 1 & 2
This post covers the first two modules in the challenge collection, since those were covered by one Learn Together session in the wave 1 live training sessions:
Introduction to end-to-end analytics using Microsoft Fabric
- This module is the introduction and background to Fabric, and it is very short since the focus in the other modules is the specific elements in more detail. There were no exercises in this module to follow, although you could follow through the steps in Unit 4 to enable Fabric in your tenant or see what that would look like.
Get started with lakehouses in Microsoft Fabric
- This module is about lakehouses, creating them, and ingesting data into them. Unit 5 is an optional exercise to get hands-on with creating a Fabric trial workspace, creating a lakehouse, loading data from a CSV file, creating a table from the file data, and performing some queries on the data as well as a basic Power BI report. It is helpful to me to perform the exercises to work through some of the concepts. This was not a "complicated" one, but still new to me.
Learn Together links (recordings from wave 1)
Initially, I attended the Pacific time zone version of the "Day 1" learning session, but a couple of things made it difficult for me to focus on what was being said (microphone issues with one of the presenters being one of them). I ended up leaving the live session and watching the recording from the earlier Asia-Pacific session instead. This was presented by Microsoft MVPs Heidi Hastings and Treb Gatte.
Key takeaways
The foundation of Microsoft Fabric for me is getting to "one source of truth", one version of your data, no matter what its format is. OneLake is the underpinning of everything and can include structured or unstructured data in a variety of formats. It is a "OneDrive for data".

There are various tools in Fabric for end-to-end analytics but the thing that resonated with me is that "end-to-end" isn't going to be the same for every organization or scenario within an organization. What is important to understand is having all the data teams need for reporting in one place means less time spent combining various data or services from different vendors, and less time moving or copying data between different teams that need to collaborate on the data. The former reduces some of the complexity, and the latter reduces the change of multiple versions of the data, with ambiguity as to which data is the most accurate.
From an SMB (small & medium-sized business) standpoint, some of this isn't as relevant in the sense that there are likely to be a handful of people who wear more "hats" in their organization vs. enterprise-level organizations that have entire teams focused on one specific element. The collaboration features would be beneficial to most sizes of organizations though, as the smaller the organization, the more likely that some of the work is outsourced, and having a SaaS solution that multiple contributors can easily access is a good thing.
A Lakehouse acts as a database, combining the best of both data warehouses (relational databases) and data lakes (flexible file storage). It is organized in a "schema-on-read" format, as opposed to having a pre-defined schema that would be typical in a data warehouse. Data can be loaded in from local files, databases, APIs etc., in most common formats, or use shortcuts to external sources. Ingestion can be automated with Dataflows (Gen2), Notebooks, or Data Factory Pipelines to name a few options. Using the Lakehouse Explorer, as shown in the exercises, the contents (files, folders, shortcuts or databases) can be viewed assuming you have permission to do so.
Each lakehouse by default comes with a SQL analytics endpoint which you can connect to right from tools like SQL Server Management Studio to query the data.
Steps that will be defined in later modules include further transforming data into a reporting-capable model, assuming that in most scenarios the data loaded in at this stage is "raw" and not immediately ready for consistent reporting.


